Waveform Audio Player using HTML5 Canvas
Playback:
Customisation:
Version 1
Existing Implementations
SoundCloud
- Pre-computed on track upload by SoundCloud and sent to each user.
- Rendered using HTML5 canvas.
- Made use 3 separate overlayed canvas elements:
- A canvas to display the waveform bars and change the colour based on current position in song.
- A canvas to display the time on the left and right side of the waveform.
- A canvas to display the avatars of users who comment on the track, as well as brief sections of their comment as the play-head pass that position.
wavesurfer.js
Available here.
- Requires including a JavaScript file.
- Rendered using HTML5 canvas.
- The full audio file must be loaded client-side before the waveform can be drawn.
Generating the Waveform (FFmpeg)
It is important that the waveform be white, and the background be black rather than transparent. See the CSS section for why (involves colour blending modes).
The following command will generate a waveform image from an audio file:1
ffmpeg -n -i "input_file.wav"
	-filter_complex "compand=gain=4,
		showwavespic=s=640x64:colors=white|white[fg];
		color=black:640x64[bg];
		[bg][fg]overlay=format=auto,
		drawbox=x=(iw-w)/2:y=(ih-h)/2:w=iw:h=1:color=white"
	-frames:v 1 "output.png"
The components of the filter_complex work as follows:
compand=gain=4 - Increases the volume (gain) of the track before processing (Needs to be adjusted based on aspect ratio of the output image otherwise the waveform will not fill out the image vertically.)
showwavespic=s=640x64:colors=white|white[fg]; - Generate the waveform using the built-in FFmpeg filter of specified size (640x64), with both channels set to white. Assign this image to the foreground layer.
color=black:640x64[bg] - Create a pure black area to fill the background.
[bg][fg]overlay=format=auto, - Combine the background and foreground.
drawbox=x=(iw-w)/2:y=(ih-h)/2:w=iw:h=1:color=white - Draw a thin 1 pixel box along the centre of the image to represent silence audio which would otherwise be invisible.
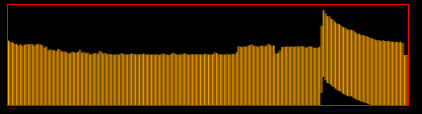
This command produces the following output:

Notice how when the amplitudes of the two channels overlap when they are the same; and how some spikes appear grey when one channel is louder than the other.
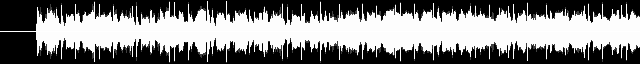
The horizontal line for silence at the beginning the created by the drawbox filter.
Dynamic Colour Effect (HTML, CSS)
The colour changing effect works by overlaying a stylised input slider over the waveform image. onclick attributes are assigned to elements that call JavaScript functions defined in a script tag included in the header.
<div class="item">
<p>
<span class="name">FILENAME</span>
</p>
<div>
<span class="play_toggle" id="status_FILENAME" onclick="toggle_playback(document.getElementById('FILENAME'), this);">⏵</span>
<div class="waveform" style="background-image: url('assets/images/FILENAME.png');">
<input class="slider" type="range" min=0 max=1 step="any" value=0 id="FILENAME_tracker" onchange="seek(document.getElementById('FILENAME'), document.getElementById('status_FILENAME'), this.value)">
</div>
</div>
<audio id="FILENAME" class="audio_file" ontimeupdate="time_update(this, document.getElementById('FILENAME_tracker'))">
<source src="assets/audio/FILENAME.mp3" type="audio/mpeg">
</audio>
</div>
The colour changing effect is created by the use of mix-blend-mode: multiply which multiplies the colour of the current element by all other elements behind it (Although in this case, I am using isolation: isolate on its parent element to limit the propagation of the blend mode). This is also the reason why it was important that the waveform image have a white foreground and a black background. Using multiply has full effect on white (like multiplying the multiplied colour by one) and will show the original colour, multiply on black will return simply black.
audio {
	-webkit-appearance:none;
}
.slider {
	-webkit-appearance: none;
	appearance: none;
	mix-blend-mode: multiply;
}
.waveform {
	isolation: isolate;
}
Generating the Webpage (Python)
I created a form of static site generator to turn the HTML snippets into a full webpage. It processes each file as a distinct player on the webpage.
import os

# audio files input directory
rootdir = "C:/test/"

# output directory
outdir = os.getcwd()

validfiles = []

# load template files
header = open("header.html", "r").read()
item = open("item.html", "r").read()
footer = open("footer.html", "r").read()

# recursively search input directory for valid files
for subdir, dirs, files in os.walk(rootdir):
	for file in files:
		if file.endswith(".wav"):
			validfiles.append(os.path.join(subdir, file))

# clean up and create folders
os.makedirs(os.path.join(outdir, "assets"), exist_ok=True)
os.makedirs(os.path.join(outdir, "assets/images"), exist_ok=True)
os.makedirs(os.path.join(outdir, "assets/audio"), exist_ok=True)
if os.path.exists("index.html"):
  os.remove("index.html")

# create output html
outindex = open("index.html", "a")
outindex.write(header)

for file in validfiles:
	# get filename
	filename = os.path.basename(file).split(".")[0]

	# populate command for compressing the input audio for web use
	text_compress = f'ffmpeg -n -i "{file}" "{os.path.join(os.path.join(outdir, "assets/audio"), filename + ".mp3")}"'

	# populate command for generating waveform
	text_image = f'ffmpeg -n -i "{file}" -filter_complex "compand=gain=4,showwavespic=s=640x64:colors=white|white[fg];color=black:640x64[bg];[bg][fg]overlay=format=auto,drawbox=x=(iw-w)/2:y=(ih-h)/2:w=iw:h=1:color=white" -frames:v 1 "{os.path.join(os.path.join(outdir, "assets/images"), filename + ".png")}"'

	# execute the commands
	os.system(text_compress)
	os.system(text_image)

	# populate item html template and append to output html
	outindex.write(item.replace("FILENAME", filename))

# finalise html and close
outindex.write(footer)
outindex.close()
Evaluating Version 1
- Not the best compatibility as it uses
mix-blend-mode.2 - Doesn’t look the greatest.
- No support for styling (Must be black and white with an accent colour.)
- Peaks appear too noisy.
- Minimal interactivity.
- Each resolution to display at requires a different image to be rendered and sent.
- Otherwise you must up- or down-scale a “base” image client-side.
Version 2
Fundamental Differences in Version 2
- Waveform data should be separate from the display (no images).
- This will also result in less data being transferred.
- Should render client-side at appropriate resolution.
- Use AJAX for dynamic loading of data.
FFmpeg Proof of Concept
For generating the data, we need to be able to take an arbitrary amount of samples from an audio file. This is simplest if we convert the input audio into a known sample rate as FFmpeg requires an input of samples rather than time.3 This can be done by:
-
Choose how many samples should be taken, in this case, we will use
200. Also choose the sample rate of the converted audio, we will use44100. -
Getting the length of the audio input file using
ffprobe.4 For explanation purposes, we will say this is120.0(seconds).ffprobe -i in.mp3 -show_entries format=duration -v quiet -of csv="p=0" -
Calculate how many sample points are needed to reach the total number of samples that should be taken (
200) given the sample rate (44100).python -c "print(AUDIO_LENGTH / SAMPLES_TOTAL * SAMPLERATE)" python -c "print(120.0 / 200 * 44100)" -
Perform the sampling…
ffmpeg -v quiet -i in.mp3
 -af "aresample=SAMPLERATE,
     asetnsamples=AUDIO_LENGTH / SAMPLES_TOTAL * SAMPLERATE,
     astats=metadata=1:reset=1:length=0.05,
     ametadata=print:key=lavfi.astats.Overall.RMS_level
     :file=-"
 -f null -
The components of the
af(audio filter) work as follows:aresample- Resample the audio to the defined sample rate before further processing.asetnsamples- Set the number of samples per frame to the value calculated on the previous step.astats- Set up the settings for sampling the audio frames.5ametadata- Defines what information should be printed per-frame of audio, in this case, we uselavfi.astats.Overall.RMS_levelto measure the RMS (can be thought of as ‘average’) audio level per frame.:file=-- Tell the previous command to write to a file or any output it can write to. In this case, we use-to have it output tostdout.-f null -- Force the output tonull. This means that the command won’t output any files.When written to a text file, this command gives an output of the following: (I have added new lines for readability, the real output is only on one line, separated by spaces)
frame:0 pts:0 pts_time:0 lavfi.astats.Overall.RMS_level=-33.006038 frame:1 pts:27942 pts_time:0.633605 lavfi.astats.Overall.RMS_level=-29.351564 frame:2 pts:55884 pts_time:1.26721 lavfi.astats.Overall.RMS_level=-32.318644 frame:3 pts:83826 pts_time:1.90082 lavfi.astats.Overall.RMS_level=-28.334302 frame:4 pts:111768 pts_time:2.53442 lavfi.astats.Overall.RMS_level=-28.990816 frame:5 pts:139710 pts_time:3.16803 lavfi.astats.Overall.RMS_level=-25.944028 frame:6 pts:167652 pts_time:3.80163 lavfi.astats.Overall.RMS_level=-26.961748 frame:7 pts:195594 pts_time:4.43524 lavfi.astats.Overall.RMS_level=-26.862652 ... frame:198 pts:5532516 pts_time:125.454 lavfi.astats.Overall.RMS_level=-31.983491 frame:199 pts:5560458 pts_time:126.087 lavfi.astats.Overall.RMS_level=-32.936003 -
Format the output into a pure list of RMS levels using the following pipes:
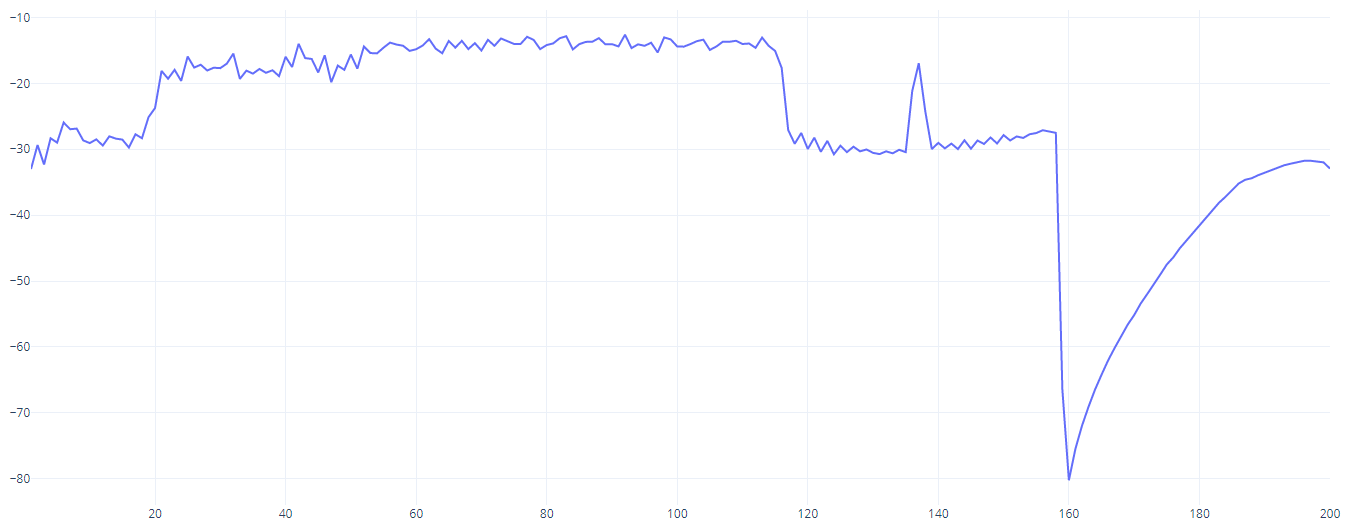
echo OUTPUT | awk 'BEGIN{ RS = " " ; FS = "=" } /lavfi.astats.Overall.RMS_level/ {print $2}' | tr -s '\n' | head --bytes=-1 > data.txtawk- Split on spaces and ‘=’, then match any field withlavfi.astats.Overall.RMS_leveland take the second value separated by ‘=’ which is the value we want. Unfortunately, this leaves some trailing new line characters at the end, but this can be fixed with two other commands.tr -s '\n'- Squeeze any double (or more) new lines into a single new line.head --bytes=-1- Remove the final new line at the bottom of the file. This is needed otherwise when the file is split via new lines in JavaScript, a blank entry will be at the end.Using these commands results in the following output to
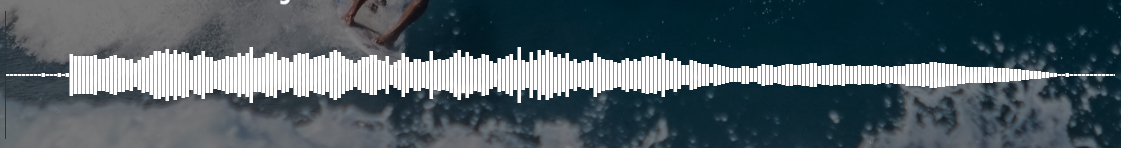
data.txt:-33.006038 -29.351564 -32.318644 -28.334302 -28.990816 -25.944028 -26.961748 -26.862652 -28.654364 -29.063103 ...Plotting this data as a graph confirms it gives an accurate result:
We can put the above steps together in a script like so:
#!/bin/bash

samples=200
sampleratehz=44100
length=`ffprobe -i in.mp3 -show_entries format=duration -v quiet -of csv="p=0"`
echo "Length: $length"

samplerate=`python -c "print($length/$samples * $sampleratehz)"`
echo "Rate: $samplerate"

output=`ffmpeg -v quiet -i in.mp3 -af aresample=$sampleratehz,asetnsamples=$samplerate,astats=metadata=1:reset=1:length=0.05,ametadata=print:key=lavfi.astats.Overall.RMS_level:file=- -f null -`

echo $output | awk 'BEGIN{ RS = " " ; FS = "=" } /lavfi.astats.Overall.RMS_level/ {print $2}' | tr -s '\n' | head --bytes=-1 > data.txt

echo $output > raw.txt
Drawing the Waveform (HTML5 Canvas)
Fetching and Basic Drawing
To begin drawing, we first need a canvas element to draw on:
<canvas id="testcanvas"></canvas>
Next, we can use JavaScript’s XMLHttpRequest object to request the file containing the RMS levels from the server.
var xhr = new XMLHttpRequest()
xhr.onload = function() {
	draw(this.responseText)
}
xhr.open("GET", "raw.txt", true)
xhr.send()
Then we can define a draw function to process each RMS value in the file and draw a rectangle upon the canvas in an appropriate position:
function draw(data) {
	var peaks = data.split("\n")
	var canvas = document.getElementById("testcanvas")
	var c2d = canvas.getContext("2d")

	c2d.fillStyle = "orange"
	for (let index = 0; index < peaks.length; index++) {
		const peak = Math.min(peaks[index], 0.0)
		c2d.fillRect(index * (canvas.width / peaks.length), peak + (canvas.height / 2), (canvas.width / peaks.length) - 0.5, 100)
	}
}
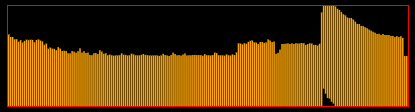
This creates the following result:
Blurry Edges Fix
The blurry edges can be fixed by moving the height and width from CSS to HTML attributes, set via JavaScript:
var canvas = document.getElementById("testcanvas")
canvas.width = 400
canvas.height = 100
Width and Height of the Rectangles
We can adjust the width and height of the individually drawn rectangles by introducing two new variables:
inaudiblewhich controls the RMS level that the signal is deemed inaudible and is not draw on the canvas. This can be seen as a sort of sensitivity.spacingwhich controls the spacing between the rectangles in pixels. Subtracting an arbitrary amount of pixels from the width of each rectangle results in a small space between them. This makes it easier to see each individual rectangle (and make it look a little nicer.)
var inaudible = -60.0
var spacing = 0.5
...

function draw(data) {
	var peaks = data.split("\n")
	var c2d = canvas.getContext("2d")

	c2d.fillStyle = "orange"
	for (let index = 0; index < peaks.length; index++) {
		const peak = Math.max(Math.min(peaks[index], 0.0), inaudible)
		c2d.fillRect(
			index * (canvas.width / peaks.length),
			(peak / inaudible) * (canvas.height),
			(canvas.width / peaks.length) - spacing,
			(peak - inaudible) / (-inaudible / (canvas.height)) - ((peak / inaudible) * (canvas.height))
		)
	}
}
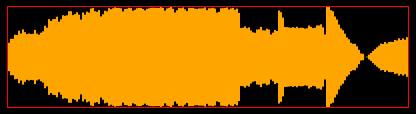
Without spacing:
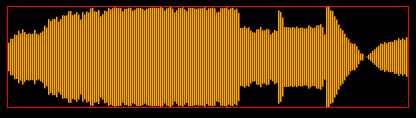
With spacing:
Audio Playback and Tracking using Animations
To play the audio, we can use an audio element that is hidden on the page and controlled only by JavaScript.
<audio id="testaudio">
	<source type="audio/mpeg" src="in.mp3"></audio>
</audio>
As we need to change the colour of the rectangles as the audio is playing, we must change how the draw function is called. We now call it from an animate function that is drawn every animation frame. We also adjust the XMLHttpRequest to store the retrieved data in a variable and call animate directly to begin the animation loop.
xhttp.onload = function() {
	data = this.responseText
	animate()
}
...
function animate() {
	requestAnimationFrame(animate)
	// skip frame if data not yet received...
	if (data.length == 0) return
	draw(data)
}
Next, we update the draw function to take into account how much of the audio has been played. The audio element is stored in the audio variable:
function draw(data) {
	var peaks = data.split("\n")
	var c2d = canvas.getContext("2d")

	// get percent played.
	var playedPercent = audio.currentTime / audio.duration

	// clear canvas
	c2d.clearRect(0, 0, canvas.width, canvas.height)

	for (let index = 0; index < peaks.length; index++) {
		...
		// get current rect as percent of total
		var indexPercent = index / peaks.length

		// if played change next fill to orange
		if (indexPercent >= playedPercent) {
			c2d.fillStyle = "orange"
		} else {
			// else red
			c2d.fillStyle = "red"
		}

		// draw rect as usual, but with updated colour
		c2d.fillRect(...)
	}
}
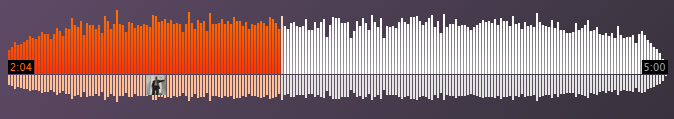
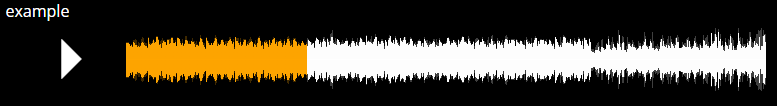
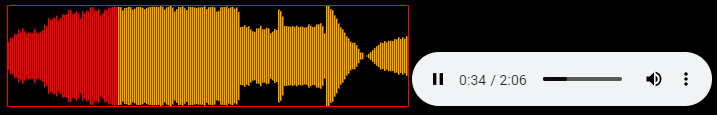
We can see that this works if we unhide the standard HTML audio element. The amount of the canvas coloured red is the same as the playback seeking bar on the audio element:
Seeking via the Canvas
Adding event listeners to the canvas allows us to detect mouse click upon it and update the audio player’s playback position accordingly:
canvas.addEventListener("mousedown", function(event) {
	// get seek percent (0 to 1)
	var seekPercent = event.offsetX / canvas.width

	// convert to audio time
	audio.currentTime = seekPercent * audio.duration
	if (audio.paused) audio.play()
})
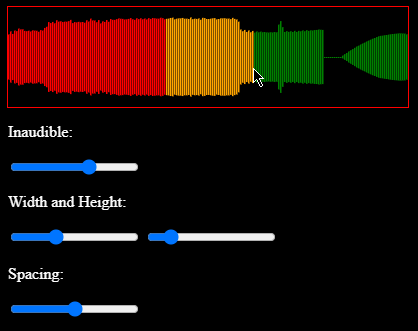
We can also add a second listener for mousemove that allows us to animate the waveform as the user moves their mouse over it:
canvas.addEventListener("mousemove", function(event) {
	mousePercentX = event.offsetX / canvas.width
})
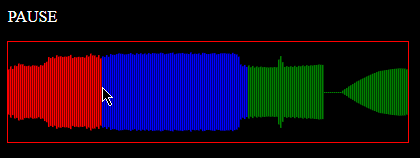
mousePercentX can now be used in the draw function to update the colour based to whether the rectangle is before or after the mouse position:
...
if (indexPercent >= playedPercent) {
	c2d.fillStyle = "orange"
	if (indexPercent >= mousePercentX) {
		c2d.fillStyle = "green"
	}
} else {
	c2d.fillStyle = "red"
	if (indexPercent >= mousePercentX) {
		c2d.fillStyle = "blue"
	}
}
...
Fixing Display Bugs
Rewrite to the fillRect function within the draw function:
c2d.fillRect(
	index * (canvas.width / peaks.length),
	(peak / inaudible) * (canvas.height / 2),
	(canvas.width / peaks.length) - spacing,
	Math.max((1.0 - (peak / inaudible)) * (canvas.height), 1.0)
)
Taking the max of the calculated height and 1.0 means that silent sections will be 1 pixel thick.
Configuration Sliders
I hooked up some HTML range sliders to the parameters used in drawing on the canvas. These are only to allow me to configure the best values for parameters and are not meant to be used by ‘end-users’.
I later added extra colour picker inputs to change the colour of the rectangles.
Play and Pause
We need a play/pause button so the user can stop playback once they have click on the canvas to seek and start it. We can use a JavaScript function to toggle the playback and update a button label to an appropriate value:
function togglePlayback() {
	if (audio.paused) {
		audio.play()
		playpause.innerHTML = pauseText
	} else {
		audio.pause()
		playpause.innerHTML = playText
	}
}
Track Selection
To create a playlist of available tracks, we first create an ordered list to show the tracks. We can use classes to keep track of which one is currently playing and also to apply a style to it. We use data- attributes to store information about each track that can be read by JavaScript.
<ol>
	<li onclick="changeTrack(this)" class="playlist-item selected" data-src="../assets/waveform2/in.mp3" data-values="/assets/waveform2/data.txt">Example 1</li>
	<li onclick="changeTrack(this)" class="playlist-item" data-src="/assets/waveform2/in_2.mp3" data-values="/assets/waveform2/data_2.txt">Example 2</li>
	<li onclick="changeTrack(this)" class="playlist-item" data-src="/assets/waveform2/in_3.mp3" data-values="/assets/waveform2/data_3.txt">Example 3</li>
</ol>
We then need to move the AJAX call to a function so it can be called from the changeTrack method when an item in the playlist is clicked:
function sendRequest(path) {
    var xhr = new XMLHttpRequest()
    xhr.onload = function() {
        rawData = this.responseText.split("\n")
        data = this.responseText.split("\n")
        animate()
    }
    xhr.open("GET", path, true)
    xhr.send()
}
The changeTrack method itself is called by the element of the playlist that was clicked on. The element contains attributes that store the path to the data of the track accessible via .dataset like so:
function changeTrack(elem) {
	// fetch the data (RMS)
    sendRequest(elem.dataset.values)

	// update selection style
    document.getElementsByClassName("selected")[0].classList.remove("selected")
    elem.classList.add("selected")

	// reset audio element
    audio.currentTime = 0.0
    playpause.innerHTML = playText

	// set source to playlist selection
    audio.getElementsByTagName("source")[0].src = elem.dataset.src
    audio.load()
}
We should check that the audio has a duration (i.e., the audio has been loaded by the browser) before attempting to draw the waveform.
function draw() {
    if (!audio.duration) return
    var playedPercent = audio.currentTime / audio.duration
	...
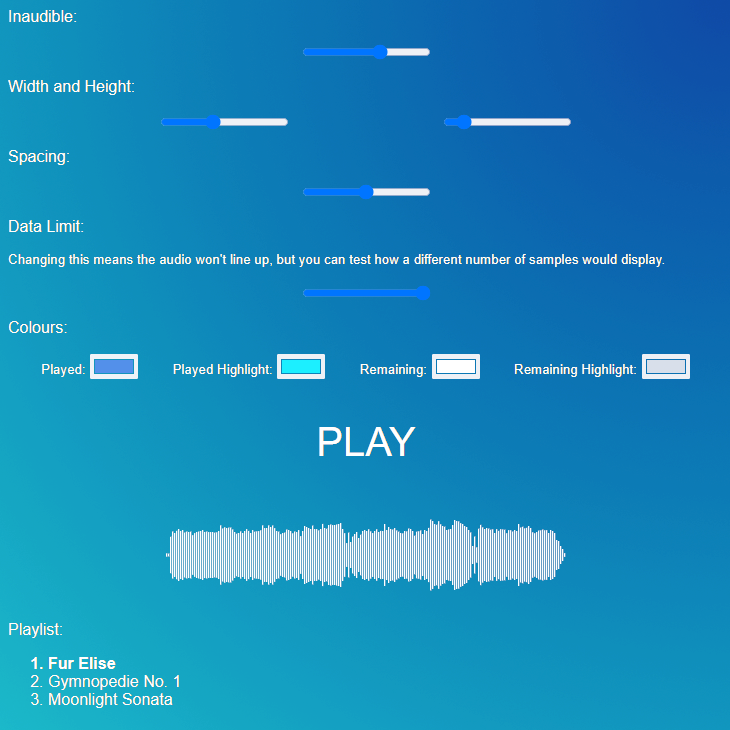
Example
Inaudible:
Width and Height:
Spacing:
Data Limit:
Changing this means the audio won’t line up, but you can test how a different number of samples would display.
Colours:
Playlist:
- Fur Elise
- Moonlight Sonata
- Gymnopedie No. 1